
Local Market Insight: January 2024
Written By: Liz Brannan
Decoded: These metrics provide insights into the dynamics of the housing market in the given area, including trends in listings, pendings, closed sales, median sold price, active listings, DOM, and the sold-to-list-price ratio.
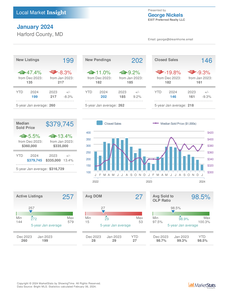
New Listings:
- In January 2024, there were 199 new listings, which decreased 8.3% from December 2023.
Compared to January 2023, there were fewer new listings, with 217 listed then. - The year-to-date (YTD) comparison shows a decrease of 8.3% compared to 2023.
- The five-year January average for new listings is 260
New Pendings:
- There were 202 new pending sales in January 2024, reflecting an increase of 9.2% from December 2023.
Compared to January 2023, there were 185 new pending sales. - The YTD comparison shows a 9.2% increase compared to 2023.
- The five-year January average for new pendings is 262.
Closed Sales:
- There were 146 closed sales in January 2024, indicating a decrease of 9.3% from December 2023.
Compared to January 2023, there were 161 closed sales. - The YTD comparison shows a decrease of 19.8% compared to 2023.
- The five-year January average for closed sales is 218.
Median Sold Price:
- The median sold price in January 2024 was $379,745, a 13.4% increase from December 2023.
Compared to January 2023, there was a 5.5% increase in median sold price. - The YTD comparison shows a 13.4% increase compared to 2023.
- The five-year January average for the median sold price is $316,729.
Active Listings:
- There were 257 active listings in January 2024, ranging from a minimum of 144 to a maximum of 579.
- The five-year January average for active listings is 257.
Average Days on Market (DOM):
- The average DOM in January 2024 was 27 days, ranging from a minimum of 15 to a maximum of 53.
- The five-year January average for DOM is 27 days.
Average Sold to Original List Price (OLP) Ratio:
- The average sold-to-list-price ratio in January 2024 was 98.5%, with a minimum of 97.5% and a maximum of 100.3%.
- The five-year January average for this ratio is 98.5%.